
잡동사니 블로그
T-SNE 차원 축소 시각화 본문
프로젝트를 진행하며 불량과 양품의 구분을 모델링 하였을 때 결과가 기대했던것 만큼 좋게 나오지는 않아서 차원축소를 통한 시각화로 EDA를 하고자 썼었다.
논문에 따르면 T-SNE 기법은 다른 Isomap 및 지역적선형임베딩(Locally Linear Embedding)기술보다 우수한 시각화 효과를 나타내었으며 거의 모든 데이터셋 에 적용된다고 한다.
기본적으로 정규분포를 쓰는 확률적 이웃 임베딩(stochastic neighbor embedding)에서 t-Distributed 함수를 써서 활용한것이 T-SNE라고 한다.
내가 프로젝트에서 활용 하였던 데이터셋을 활용 하였다.
import pandas as pd
import numpy as np
from sklearn.manifold import TSNE
import plotly.express as px
from plotly.offline import init_notebook_mode, iplot
import plotly.graph_objects as go
import warnings
import matplotlib.pyplot as plt
import seaborn as sns
warnings.filterwarnings('ignore')
기본적으로 sklearn으로 T-SNE를 불러올 수 있었다.
df2 = pd.read_csv('/content/drive/MyDrive/test.csv', encoding='cp949', sep=',', thousands = ',')
print(df2.shape)
#(9598, 324)
내가 쓰던 데이터의 feature는 323개 였었다.
T-SNE에도 여러가지 파라미터가 존재한다.
대표적으로는 이렇게 있다.
| n_iter | 반복횟수 default 값이 1000이다. |
| perplexity | 복잡도를 뜻하며 일반적으로 큰 데이터 세트일수록 큰 복잡도를 필요로하며 5~50까지의 세팅이 적절하다. default는 30이다. |
| learning_rate | 학습률을 뜻하며, 일반적으로 10~1000 사이의 값을 가지고 default는 200이다. |
| n_components | 차원수를 뜻하며 3차원도 가능하다. |
2차원
X = defect2.drop(['불량'], axis=1)
y = defect2['불량']
tsne = TSNE(random_state = 42, n_components=2, perplexity=50, n_iter=1500, learning_rate=700).fit_transform(X)
y_label = y.astype(str)
plt.figure(figsize=(15, 10))
sns.scatterplot(x=tsne[:,0],y=tsne[:,1],hue=y_label, style=y_label,legend=False)
plt.show()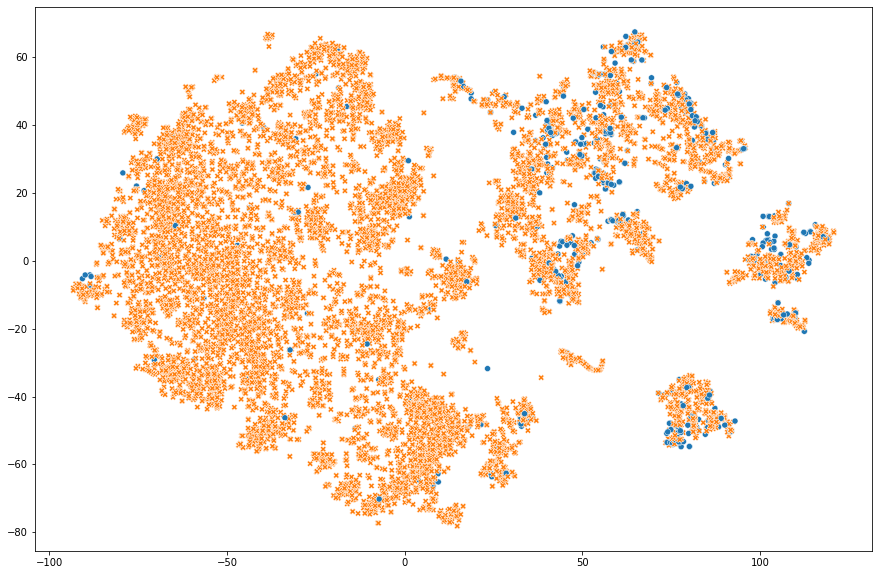
3차원
tsne = TSNE(random_state = 42, n_components=3, perplexity=50, n_iter=1500, learning_rate=700).fit_transform(X)

y_label = y.astype(str)
fig = px.scatter_3d(X, x=tsne[:,0],
                 y=tsne[:,1],
                 z=tsne[:,2],
                 color=y_label)
fig.update_layout(
                margin=dict(l=20, r=20, t=20, b=20)
)
fig.update_traces(marker_size=3)
fig.show()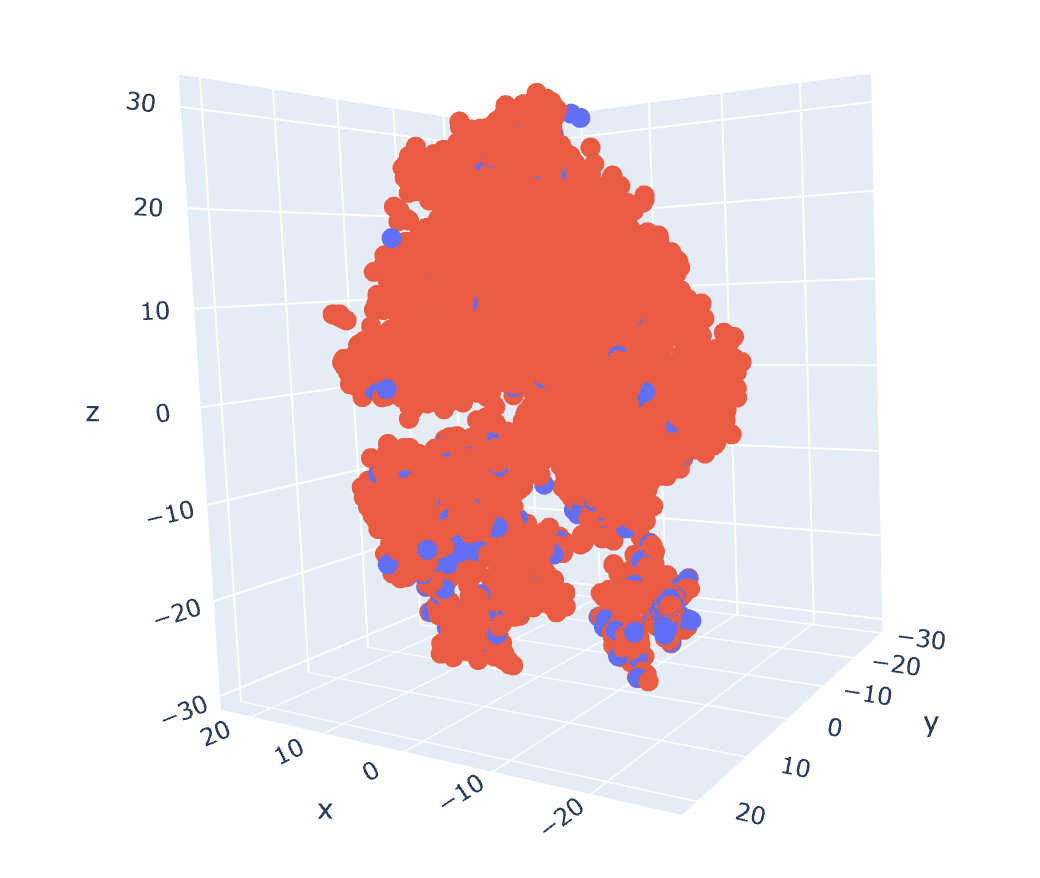
결론 : 이 데이터셋으로는 구분이 엄청나게 잘 되진 않았다. 아마 우리가 선정한 feature가 불량과 양품을 구분하는 기준이 모호했을거라고 생각했기에 T-SNE 차원축소 시각화를 통해 feature를 조금 수정할 수 있는 계기가 되었다.
틀린점이나 수정점은 댓글로 부탁드립니다!
참조 :
Van der Maaten, Laurens, and Geoffrey Hinton. "Visualizing data using t-SNE." Journal of machine learning research 9.11 (2008).
'Python' 카테고리의 다른 글
| [Python] pytorch와 sklearn의 train_test_split 활용하여 데이터 셋 나누기와 간단한 CNN (0) | 2023.09.07 |
|---|---|
| [Python] Selenium과 bs4를 이용한 크롤링 + Pyautogui (0) | 2023.08.28 |
| [Python] 시각화에 주로 쓰이는 라이브러리 3가지 (0) | 2023.08.26 |
| [Kaggle] 신용카드 사기 분류(Credit Card Fraud Detection) (1) | 2022.09.02 |
| SMOTE를 활용한 Over sampling(오버샘플링) (5) | 2022.09.01 |
'Python' Related Articles
more


